
Soal IELTS Writing

kampung-inggris-pare.id (Latihan Soal IELTS Writing Dengan Tips Mengerjakannya) – Menjadi mahasiswa atau profesional yang ingin melanjutkan studi atau bekerja di luar negeri dapat menjadi tantangan yang menarik, namun juga memerlukan persiapan yang serius, termasuk menguasai bahasa Inggris. Salah satu cara untuk menunjukkan kemampuan bahasa Inggris yang diakui secara internasional adalah dengan mengambil tes IELTS. Bagian Writing dalam tes IELTS sering dianggap sebagai bagian yang paling menantang, karena memerlukan keterampilan menulis yang baik dan kemampuan untuk mengorganisir ide secara efektif dalam bahasa Inggris. Dalam artikel ini, kita akan membahas latihan soal IELTS Writing beserta tips dan triknya untuk membantu Anda meningkatkan kemampuan menulis bahasa Inggris Anda dan meraih skor yang tinggi pada tes IELTS.
Latihan Soal IELTS Writing dengan Tips Mengerjakannya
IELTS Writing
IELTS Writing adalah salah satu bagian dari tes IELTS (International English Language Testing System) yang terdiri dari dua tugas. Tugas pertama adalah menulis sebuah esai dengan panjang sekitar 150 kata dalam waktu 20 menit. Tugas kedua adalah menulis sebuah esai dengan panjang sekitar 250 kata dalam waktu 40 menit. Tugas ini dirancang untuk menilai kemampuan seseorang dalam mengekspresikan ide dan argumen secara efektif dalam bahasa Inggris.
Tugas pertama biasanya lebih mudah daripada tugas kedua. Di tugas pertama, biasanya peserta diminta untuk memberikan pendapat atau membandingkan dan kontras suatu topik tertentu. Sedangkan di tugas kedua, biasanya peserta diminta untuk memberikan argumen mendukung atau menentang suatu pernyataan, atau menulis sebuah esai berdasarkan pada data yang diberikan.
Kunci keberhasilan dalam mengerjakan soal IELTS Writing adalah memahami tugas yang diberikan dan menulis dengan jelas dan terstruktur. Selain itu, penting juga untuk menggunakan berbagai kosa kata dan tata bahasa yang tepat serta memperhatikan tata letak dan ejaan yang benar.
Baca juga: Latihan Soal IELTS Speaking
Tips Mengerjakan IELTS Writing dengan Nilai yang Tinggi
Selain memiliki kemampuan bahasa Inggris yang baik dalam grammar, mengerjakan soal IELTS writing juga perlu memperhatikan dan mempersiapkan beberapa hal berikut ini agar kamu mendapatkan nilai yang tinggi. Berikut adalah tips mengerjakan IELTS Writing:
1. Pahami Tugas dengan Baik
Penting untuk membaca instruksi tugas dengan cermat dan memastikan bahwa Anda memahami secara jelas apa yang diminta dalam tugas tersebut. Jangan langsung mulai menulis tanpa memahami instruksi karena dapat membuat Anda tersesat dari topik yang ditentukan.
2. Buatlah Kerangka atau Outline
Sebelum mulai menulis, buatlah kerangka atau outline yang jelas dan terstruktur. Kerangka tersebut dapat membantu Anda mengatur ide-ide dan argumen-argumen Anda dengan rapi sehingga akan lebih mudah untuk mengembangkan tulisan Anda dengan baik.
3. Fokus Pada Pertanyaan
Dalam mengerjakan soal IELTS Writing, pastikan bahwa setiap bagian dari tulisan Anda berkaitan langsung dengan pertanyaan yang diberikan. Jangan sampai terlalu banyak berbicara hal-hal yang tidak relevan dengan topik yang telah ditentukan karena dapat mengurangi kesan keseluruhan dari tulisan Anda.
4. Gunakan Kosakata yang Tepat
Kosakata yang tepat dan bervariasi sangat penting dalam tulisan IELTS Writing. Cobalah untuk menggunakan kosakata yang sesuai dan sesuai dengan topik yang sedang dibahas agar tulisan Anda terdengar lebih profesional dan terstruktur.
5. Perhatikan Tata Bahasa
Tata bahasa dan ejaan yang benar sangat penting dalam tulisan IELTS Writing. Pastikan Anda memahami tata bahasa Inggris dengan baik dan melakukan periksaan ulang untuk memastikan bahwa tidak ada kesalahan dalam penulisan.
6. Perhatikan Waktu
Pastikan bahwa Anda membagi waktu dengan baik antara tugas pertama dan kedua, dan juga antara bagian-bagian yang berbeda dalam setiap tugas. Cobalah untuk tidak terlalu banyak menghabiskan waktu pada satu bagian saja sehingga Anda memiliki waktu yang cukup untuk menyelesaikan seluruh tugas dengan baik.
7. Periksa Kembali Tulisan Anda
Setelah selesai menulis, periksa kembali tulisan Anda untuk memastikan bahwa tidak ada kesalahan ejaan, tata bahasa, atau struktur kalimat. Pastikan juga bahwa tulisan Anda mudah dipahami dan memiliki alur yang jelas dan terstruktur.
8. Berlatih
Berlatihlah menulis esai secara teratur dengan tema-tema yang berbeda dan dalam waktu yang ditentukan. Hal ini akan membantu meningkatkan kemampuan menulis dan meningkatkan kemungkinan mendapatkan nilai tinggi di IELTS Writing. Semakin sering Anda berlatih menulis, semakin baik kemampuan menulis Anda.
9. Baca Contoh Tulisan yang Bagus
Membaca contoh tulisan yang bagus dari penulis-penulis yang ahli dalam bahasa Inggris dapat membantu memperbaiki kemampuan menulis dan memberikan ide tentang cara membuat tulisan yang efektif. Banyak sumber online yang menyediakan contoh tulisan IELTS Writing yang dapat Anda baca dan pelajari.
Contoh Soal
Berikut ini adalah contoh-contoh soal IELTS Writing yang bisa digunakan sebagai bahan latihan:
Percentage of Adults of Different Age in The UK
The chart below shows the percentage of adults of different age in the UK who used the Internet everyday from 2003-2006. Summarize the information by selecting and reporting the main features, and make comparisons where relevant.

Diagram The Plan of a Medical Centre
The chart below shows the percentage of adults of different age in the UK who used the Internet everyday from 2003-2006. Summarize the information by selecting and reporting the main features, and make comparisons where relevant.

Information Of Total Health Expenditure Per Capita
Summarise the information by selecting and reporting the main features, and make comparisons where relevant.

The Process of Making Wool
The picture shows the process of making wool. Summarise the information by selecting and reporting the main features, and make comparisons where relevant.

Line Graph (The Percentage Of People Accessing News From 4 Sources: TV, Radio, Newspaper, Internet)
Summarise the information by selecting and reporting the main features, and make comparisons where relevant.

The Small-Scale Production of Smoked Fish
The diagram shows the small-scale production of smoked fish. Summarise the information by selecting and reporting the main features, and make comparisons where relevant.

A Museum and It’s Surroundings
Summarise the information by selecting and reporting the main features and make comparisons where relevant.

The Protein and Calorie
The charts below show the protein and calorie intakes of people in different parts of the world. Compare and contrast.

Steps in Processing The Cocoa Beans
The diagram below shows the steps of processing cocoa beans. Summarise the information by selecting and reporting the main features and make comparisons where relevant.

Water Levels in Reservoirs in Australia
Summarise the information by selecting and reporting the main features and make comparisons where relevant.

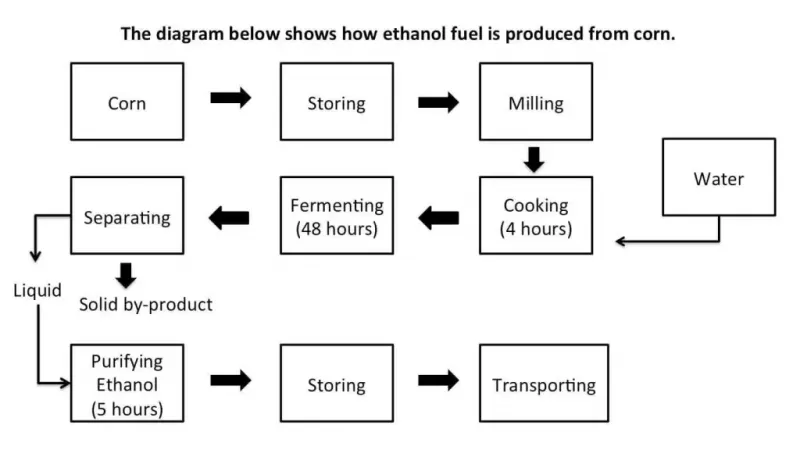
How Ethanol Fuel is Produced From Corn
Summarise the information by selecting and reporting the main features and make comparisons where relevant.
Organisations Bar Chart (Real Past IELTS Tests/Exams)
The chart below gives information about billions of euros invested in four areas by various organisations.

Higher Education Bar Chart (Real Past IELTS Exam/Test)
The bar chart shows the percentage of young people in higher education in 2000, 2005 and 2010.

Concerts Line Chart
The graph below shows the percentage of people in different age groups in one city who attended music concerts between 2010 and 2015.

UK Households Bar Chart
The chart compares the number of people per household by percentage in the UK in 1981 and 2001.

Tourists Visiting a Caribbean Island
The graph below shows the number of tourist visiting a particular Caribbean Island between 2010 and 2017. Summarise the information by selecting and reporting the main features and make comparisons where relevant.

Line Graph (Steel)
The line charts give information about the demand for steel and number of workers employed in a country from January to December.

British Emigration
Summarise the information by selecting and reporting the main features and make comparisons where relevant.

Households with Cars
The bar chart shows the percentage of households with cars in a European country between 1971 and 2001. Summarise the information by selecting and reporting the main features and make comparisons where relevant.

Landfill for Household Waste
The process details designs of a modern landfill for household waste.

Baca juga: 5 Rekomendasi Buku IELTS untuk Pemula
Seniors
The bar chart shows the percentage of elderly citizens in three countries in 1980, 2000, and 2030. Summarise the information by selecting and reporting the main features, and make comparisons where relevant.

A Theatre in 2010 and 2012
The plans below show a theatre in 2010 and 2012. Summarise the information by selecting and reporting the main features and making comparisons where relevant.

Exports Table
The table below shows the changes in exports in HK billions between 2009 and 2010.

Independent Films Table
The table shows independent film releases by genre in the UK and Republic of Ireland in 2012.

World Production
The bar graph shows the total manufacturing production in percentages Asia, Europe, and the rest of the world.

Museums
The bar chart shows the number of visitors to four London museums.

Wool
The diagram details the process of making wool. Summarise the information by selecting and reporting the main features, and make comparisons where relevant.

Mining Town
The plans below show the site of mining town in the past and after redevelopment in the present day. Summarise the information by selecting and reporting the main features, and make comparisons where relevant.

Consumption of Milk and Butter
The table below illustrates weekly consumption by age group of dairy products in a European country.
Summarise the information by selecting and reporting the main features, and make comparisons where relevant.

Urban and Rural Population Trends
The bar chart illustrates population trends globally by percentage from 1950 to 2040.
Summarise the information by selecting and reporting the main features, and make comparisons where relevant.

Baca juga: Tips Persiapan IELTS Mandiri di Rumah
Volcanic Island Chain in Hawaii

IELTS Writing Task 1: Science Park Map
The maps below show a science park in 2008 and the same park today.
Summarise the information by selecting and reporting the main features, and make comparisons where relevant.

Transport Preferences Among Young People
The bar chart below shows transport preferences among young people in four countries in a single year.
Summarise the information by selecting and reporting the main features, and make comparisons where relevant.
Influencers Bar Chart
Summarise the information by selecting and reporting the main features, and make comparisons where relevant.

Cement and Concrete Production Process
The diagrams below show the stages and equipment used in the cement-making process, and how cement is used to produce concrete for building purposes. Summarise the information by selecting and reporting the main features, and make comparisons where relevant.

Employment for Men and Women
The charts show information about percentage of men and women aged 60-64 who were employed in four countries in 1970-2000. Summarise the information by selecting and reporting the main features, and make comparisons where relevant.

Airline Ticket Prices
The charts below give information about the price of tickets on one airline between Sydney and Melbourne, Australia, over a two-week period in 2013. Summarise the information by selecting and reporting the main features, and make comparisons where relevant.

Pie Charts Energy
Summarise the information by selecting and reporting the main features, and make comparisons where relevant.

Crime in the City Center Line Chart
The chart below show the changes that took place in three different areas of crime in New Port city center from 2003 to 2012. Summarise the information by selecting and reporting the main features, and make comparisons where relevant.

Forest Industry Production
Summarise the information by selecting and reporting the main features, and make comparisons where relevant.

Combined Pie Chart and Table
The table and pie chart illustrate populations in Australia according to different nationalities and areas. Summarize the information by selecting and reporting the main features and make comparisons where relevant.

Map of a Park
The map below describes changes to a park in 1980 and now. Summarise the information by selecting and reporting the main features, and make comparisons where relevant.

The World’s Forest
The pie charts give information about the world’s forest in five different regions.
Summarize the information by selecting and reporting the main features, and make comparisons where relevant.

Women in Australia – First Child

Map of a Museum in 1990-2010
The diagrams show a museum and its surroundings in 1990 and 2010. Summarise the information by selecting and reporting the main features, and make comparisons where relevant.

Birth Rates China and The USA
The graph below compares changes in the birth rates of China and the USA between 1920-2000. Summarise the information by selecting and reporting the main features, and make comparisons where relevant.

Age Groups and Cinema Attendance
The line chart shows average attendance at the cinema among various age groups in the US from 2000 to 2011. Summarise the information by selecting and reporting the main features, and make comparisons where relevant.

Australian Exports
The graph below shows that the percentage of Australian export to 4 countries from 1990 to 2012. The line chart shows exports in billions of dollars. Summarise the information by selecting and reporting the main features, and make comparisons where relevant.

International Students in Canada and the USA

Coffee Production Bar Chart
Summarise the information by selecting and reporting the main features, and make comparisons where relevant.

Visitors to the UK Spending Table
The table below shows the number of visitors in the UK and their average spending from 2003 to 2008. Summarise the information by selecting and reporting the main features, and make comparisons where relevant.

Leather Process
The diagram details the process of making leather products.
Summarise the information by selecting and reporting the main features, and make comparisons where relevant.

Map of a City in 1950
Summarise the information by selecting and reporting the main features, and make comparisons where relevant.

Map West Park Secondary School
You should spend about 20 minutes on this task.
The diagrams below show the changes that have taken place at West Park Secondary School since its construction in 1950.
Summarise the information by selecting and reporting the main features and make comparisons where relevant.
Write at least 150 words.

IELTS Writing Task 1: University Sports Courts
The maps below shows university sports courts in 1990 and now.
Summarise the information by selecting and reporting the main features, and make comparisons where relevant.

IELTS Writing Task 1: Map of the Town of Lynnfield
The maps below shows the town of Lynnfield in 1936 and then later in 2007.
Summarise the information by selecting and reporting the main features, and make comparisons where relevant.

IELTS Writing Task 1: Map of Pancha Village
The maps below show Pancha Village in 2005 and 2015.
Summarise the information by selecting and reporting the main features, and make comparisons where relevant.

IELTS Writing Task 1: Social Media Presence for Businesses
The bar chart illustrates the percentage of businesses in the UK who had a social media presence from 2012 to 2016.
Summarise the information by selecting and reporting the main features, and make comparisons where relevant.

IELTS Writing Task 1: Consumption of Milk and Butter
The table gives information about department and online stores in Australia in 2011.
Summarise the information by selecting and reporting the main features, and make comparisons where relevant.

IELTS Writing Task 1: Cocoa Beans and Chocolate Process Diagram
The process diagram details the steps by which liquid chocolcate is produced from cocoa beans.

IELTS Writing Task 1: Australian Residents
The line chart details the proportion of residents living in Australia in millions from different regions between 1976 and 2011.

IELTS Writing Task 1: Bridges

IELTS Writing Task 1: Pineapple Process
The process diagram details the steps by which pineapples are produced for sale.

IELTS Writing Task 1: Horse Diagram

IELTS Writing Task 1: Floorplan of a Theatre
The plans below show a theatre in 2010 and 2012. Summarise the information by selecting and reporting the main features and making comparisons where relevant.

IELTS Writing Task 1: Prehistoric Tools
The diagrams below illustrate early toos from 1.4 million years ago and 800,000 years ago. Summarise the information by selecting and reporting the main features and making comparisons where relevant.

IELTS Writing Task 1: Water Usage Australia

IELTS Writing Task 1: Map of Pentland
You should spend about 20 minutes on this task.
The map show the change of selecting and reporting the main features and make comparisons where relevant.

IELTS Writing Task 1: Oil Use

IELTS Writing Task 1: Two Graphs (Pie and Bar Charts)
Summarise the information by selecting and reporting the main features and make comparisons where relevant.

IELTS Writing Task 1: Bar Chart (Education)
The chart below gives information about levels of education by age range in the UK in 2010.

IELTS Writing Task 1: Anthropology Graduates
The chart bellows shows what Anthropology graduates from one university did after finishing their undergraduate degree course. The table shows the salaries of the anthropologist in work after five years. Summarise the information by selecting and reporting the main features and make comparisons where relevant.

IELTS Writing Task 1: Coffee and Tea Buying and Drinking Habits
The chart below shows the results of survey about people’s coffee and tea buying and drinking habits in five Australian cities. Summarise the information by selecting and reporting the main features and make comparisons where relevant.

IELTS Writing Task 1: Rainwater Diagram/Process

IELTS Writing Task 1: Ceramic Pots Process
The diagram below shows one method of manufacturing ceramic pots.

IELTS Writing Task 1: Vehicles in Australia Table
The table gives information about five types of vehicles registered in Australia in 2010, 2012, and 2014.

IELTS Writing Task 1: Table Kiwi Exports
The table below gives information about the value of exports of kiwi fruit from New Zealand to five countries between 2010 and 2012.

IELTS Writing Task 1: The Changes in Medical Funding
The graph describes The Changes in Medical Funding in four countries from 2010 to 2018. Summarise the information by selecting and reporting the main features and make comparisons where relevant.

Participated in Organized Cultural Activities and Sports

IELTS Writing Task 1: Internet Use at Home
The charts bellow give information on Internet use at home in Australia between 2010 and 2011. Summarise the information by selecting and reporting the main features and make comparisons where relevant.

IELTS Writing Task 1: The Maps an Art Centre
Summarise the information by selecting and reporting the main features and make comparisons where relevant.

IELTS Writing Task 1: A Student Accommodation Buildings
The plans below show a student accommodation buildings 2010 and now. Summarise the information by selecting and reporting the main features, and make comparisons where relevant.

IELTS Writing Task 1: The Income And Expenditure Of Brooklyn Hall
Summarise the information by selecting and reporting the main features, and make comparisons where relevant.

IELTS Writing Task 1: The Percentage Of School Children
Summarise the information by selecting and reporting the main features, and make comparisons where relevant.

IELTS Writing Task 1: The Difference in The Layout of The Conference Centre
The picture below shows the difference in the layout of the conference centre in 2010 and 2025. Summarise the information by selecting and reporting the main features, and make comparisons where relevant.

Maps of The Coastal Land Develops to a Coastal Park
Summarise the information by selecting and reporting the main features, and make comparisons where relevant.

The Expectation to Change of European
Summarise the information by selecting and reporting the main features, and make comparisons where relevant.

The Price of a Cup of Coffee
Summarise the information by selecting and reporting the main features, and make comparisons where relevant.

Baca juga: Kursus IELTS Terbaik Kampung Inggris Pare
Nah itulah tadi kesemua contoh soal IELTS Writing yang bisa kamu coba sendiri. Semoga kemampuan menulismu dalam bahasa Inggris meningkat ya!
Meningkatkan kemampuan menulis bahasa Inggris adalah proses yang memerlukan waktu, dedikasi, dan upaya yang konsisten. Namun, dengan latihan soal IELTS Writing dan menerapkan tips yang telah dibahas di atas, kamu dapat meningkatkan kemampuan menulis bahasa Inggris kamu secara signifikan dan memperoleh skor yang tinggi pada tes IELTS Writing. Ingatlah untuk mempelajari format dan jenis pertanyaan yang akan kamu temui pada tes IELTS Writing dan selalu berlatih menulis dengan waktu yang terbatas. Terakhir, jangan lupa untuk memeriksa kembali tulisan kamu untuk kesalahan tata bahasa, ejaan, dan tanda baca sebelum mengirimkannya. Semoga artikel ini bermanfaat dan sukses untuk tes IELTS Writing kamu!
Pingback: Soal TOEFL Structure dan Tips Dalam Mengerjakannya